View Time Series Metrics
This topic explains how to view accuracy metrics for an existing Time Series
View Time Series Metrics
Once you've deployed your Network of Time Series, it will start to generate Time Series Run Results for each Time Series in your Project based on the Policies you've specified. The time series data from these results is stored in the time series database. You can also insert time series data directly into the time series database.
You can query time series data in a Time Series, which allows you to look at the most recent historical data or the current forecast. You can also view accuracy metrics for a Time Series using the web application. This allows you to evaluate the forecast accuracy for a specific As Of Offset over a specific period of time.
Web Application
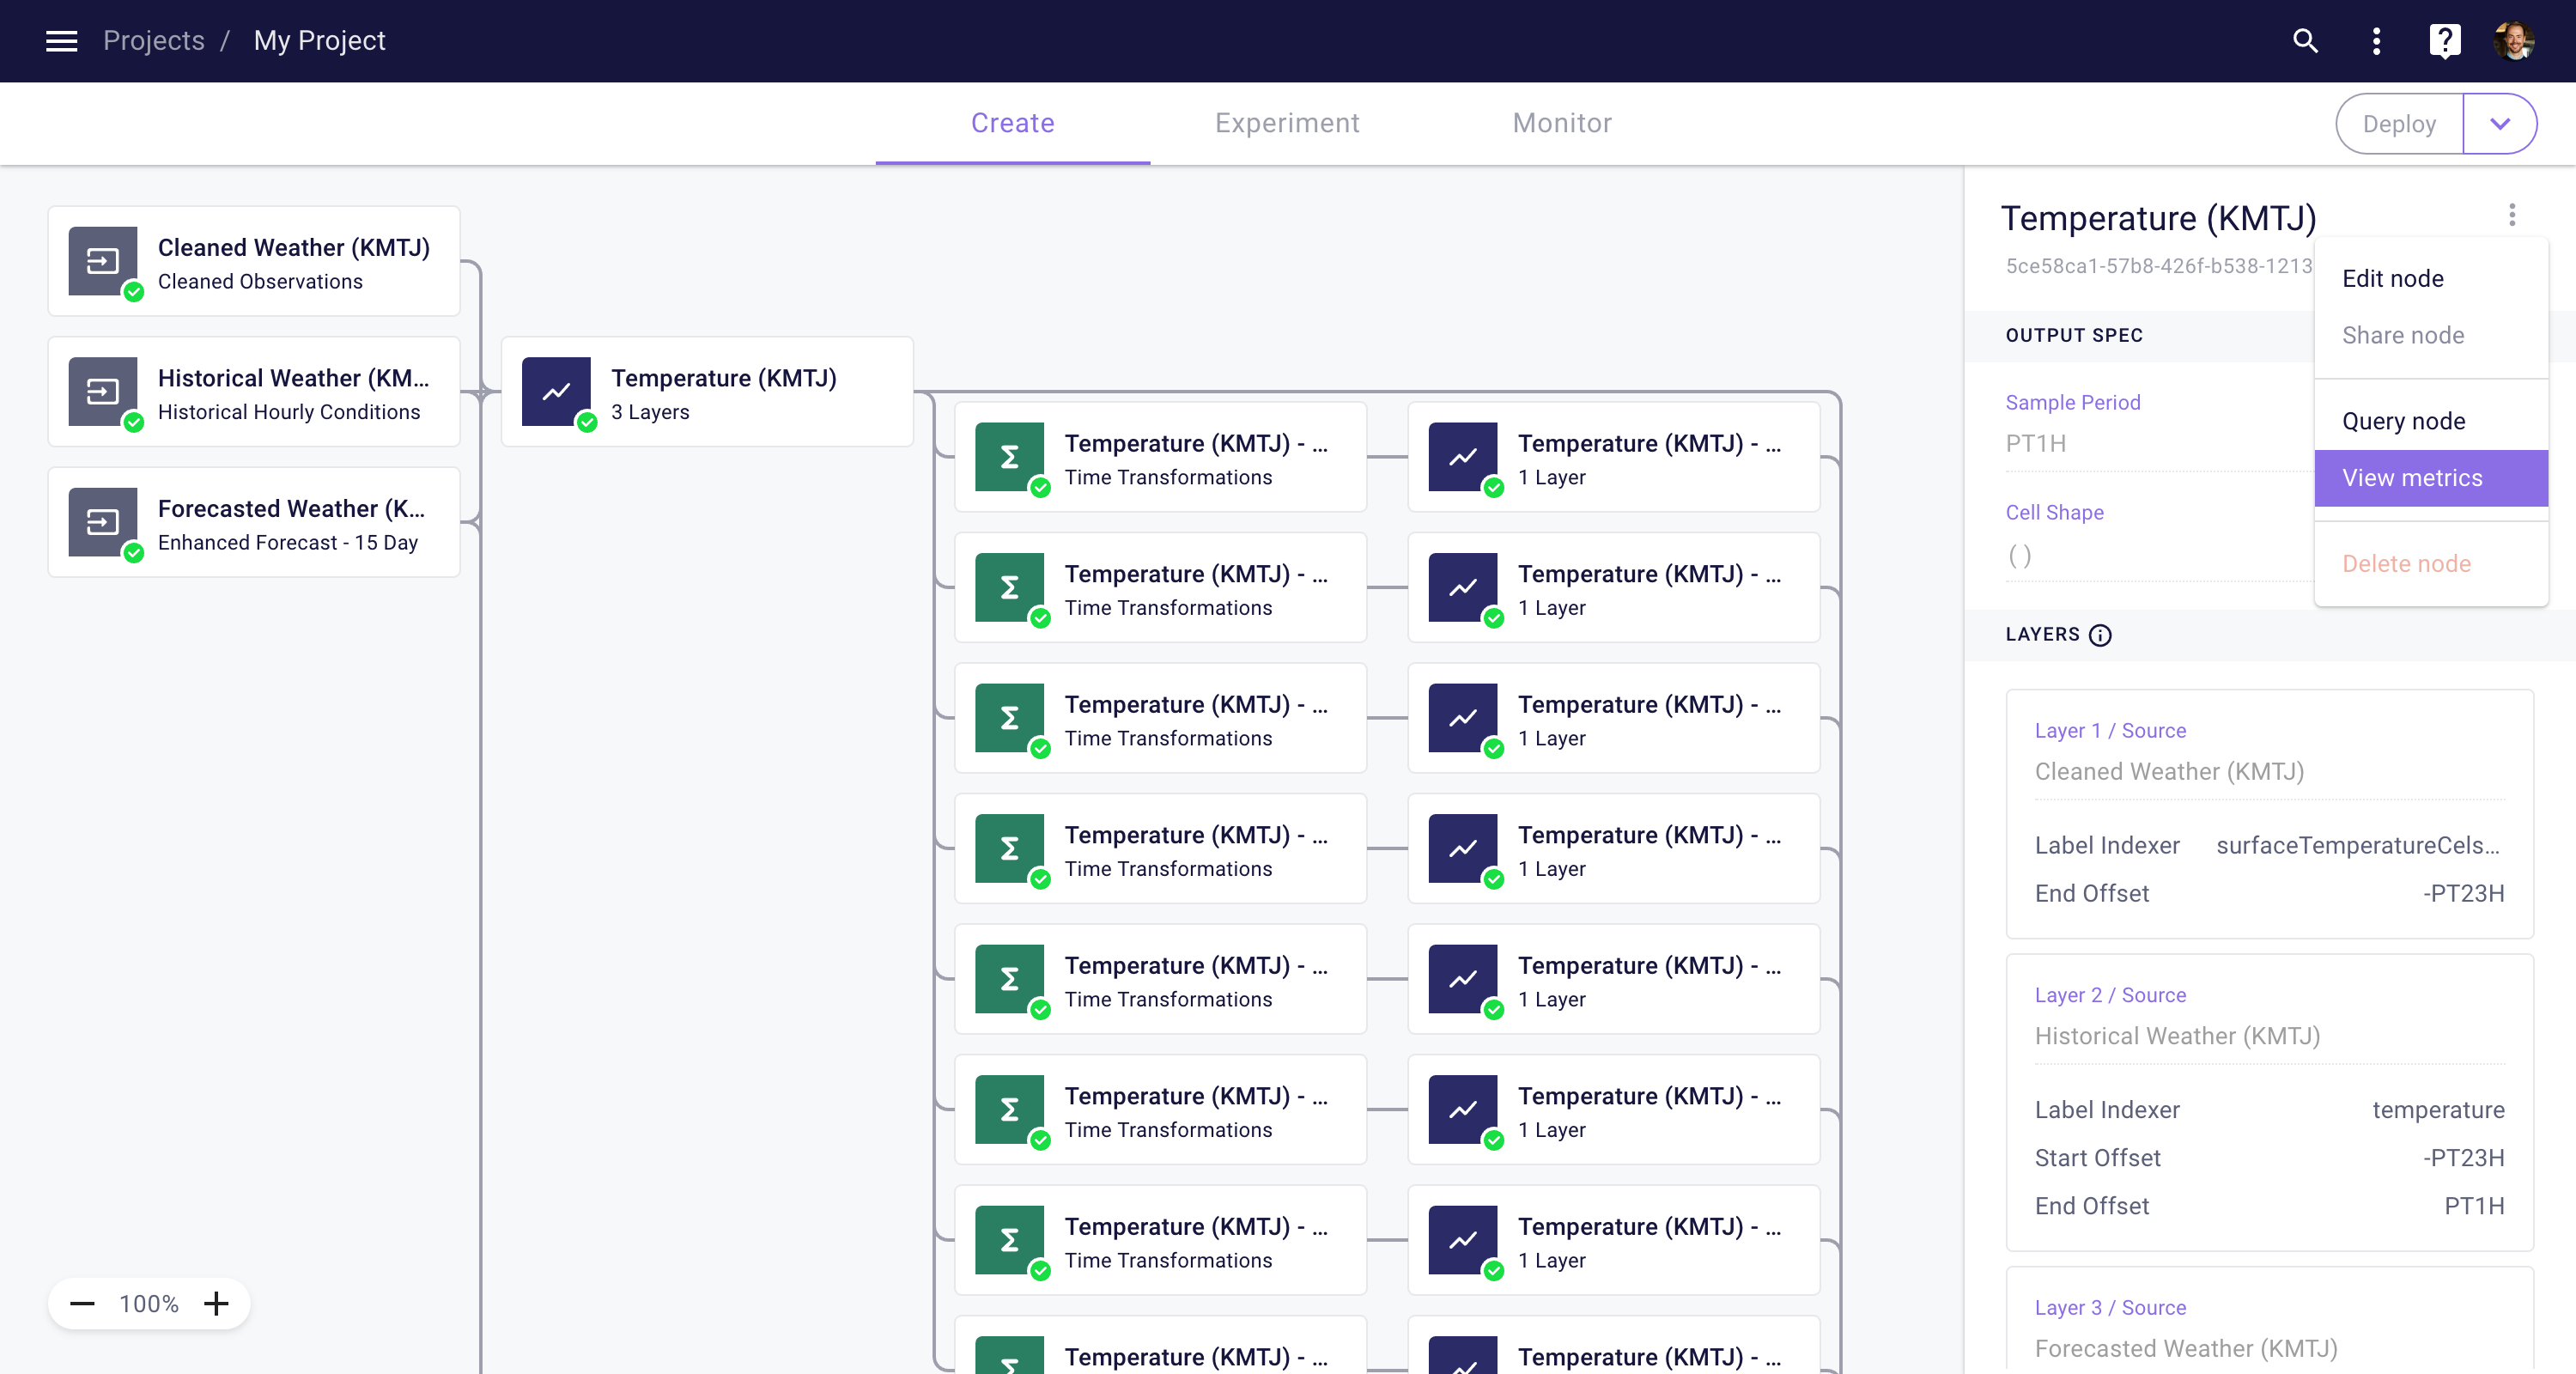
To view accuracy metrics, navigate to the Project Create space of the project that contains the Time Series you want to evaluate. Select the Time Series of interest and click on the menu in the right side-panel that is next to the title. Then click "View Metrics" to open the interactive metrics chart.

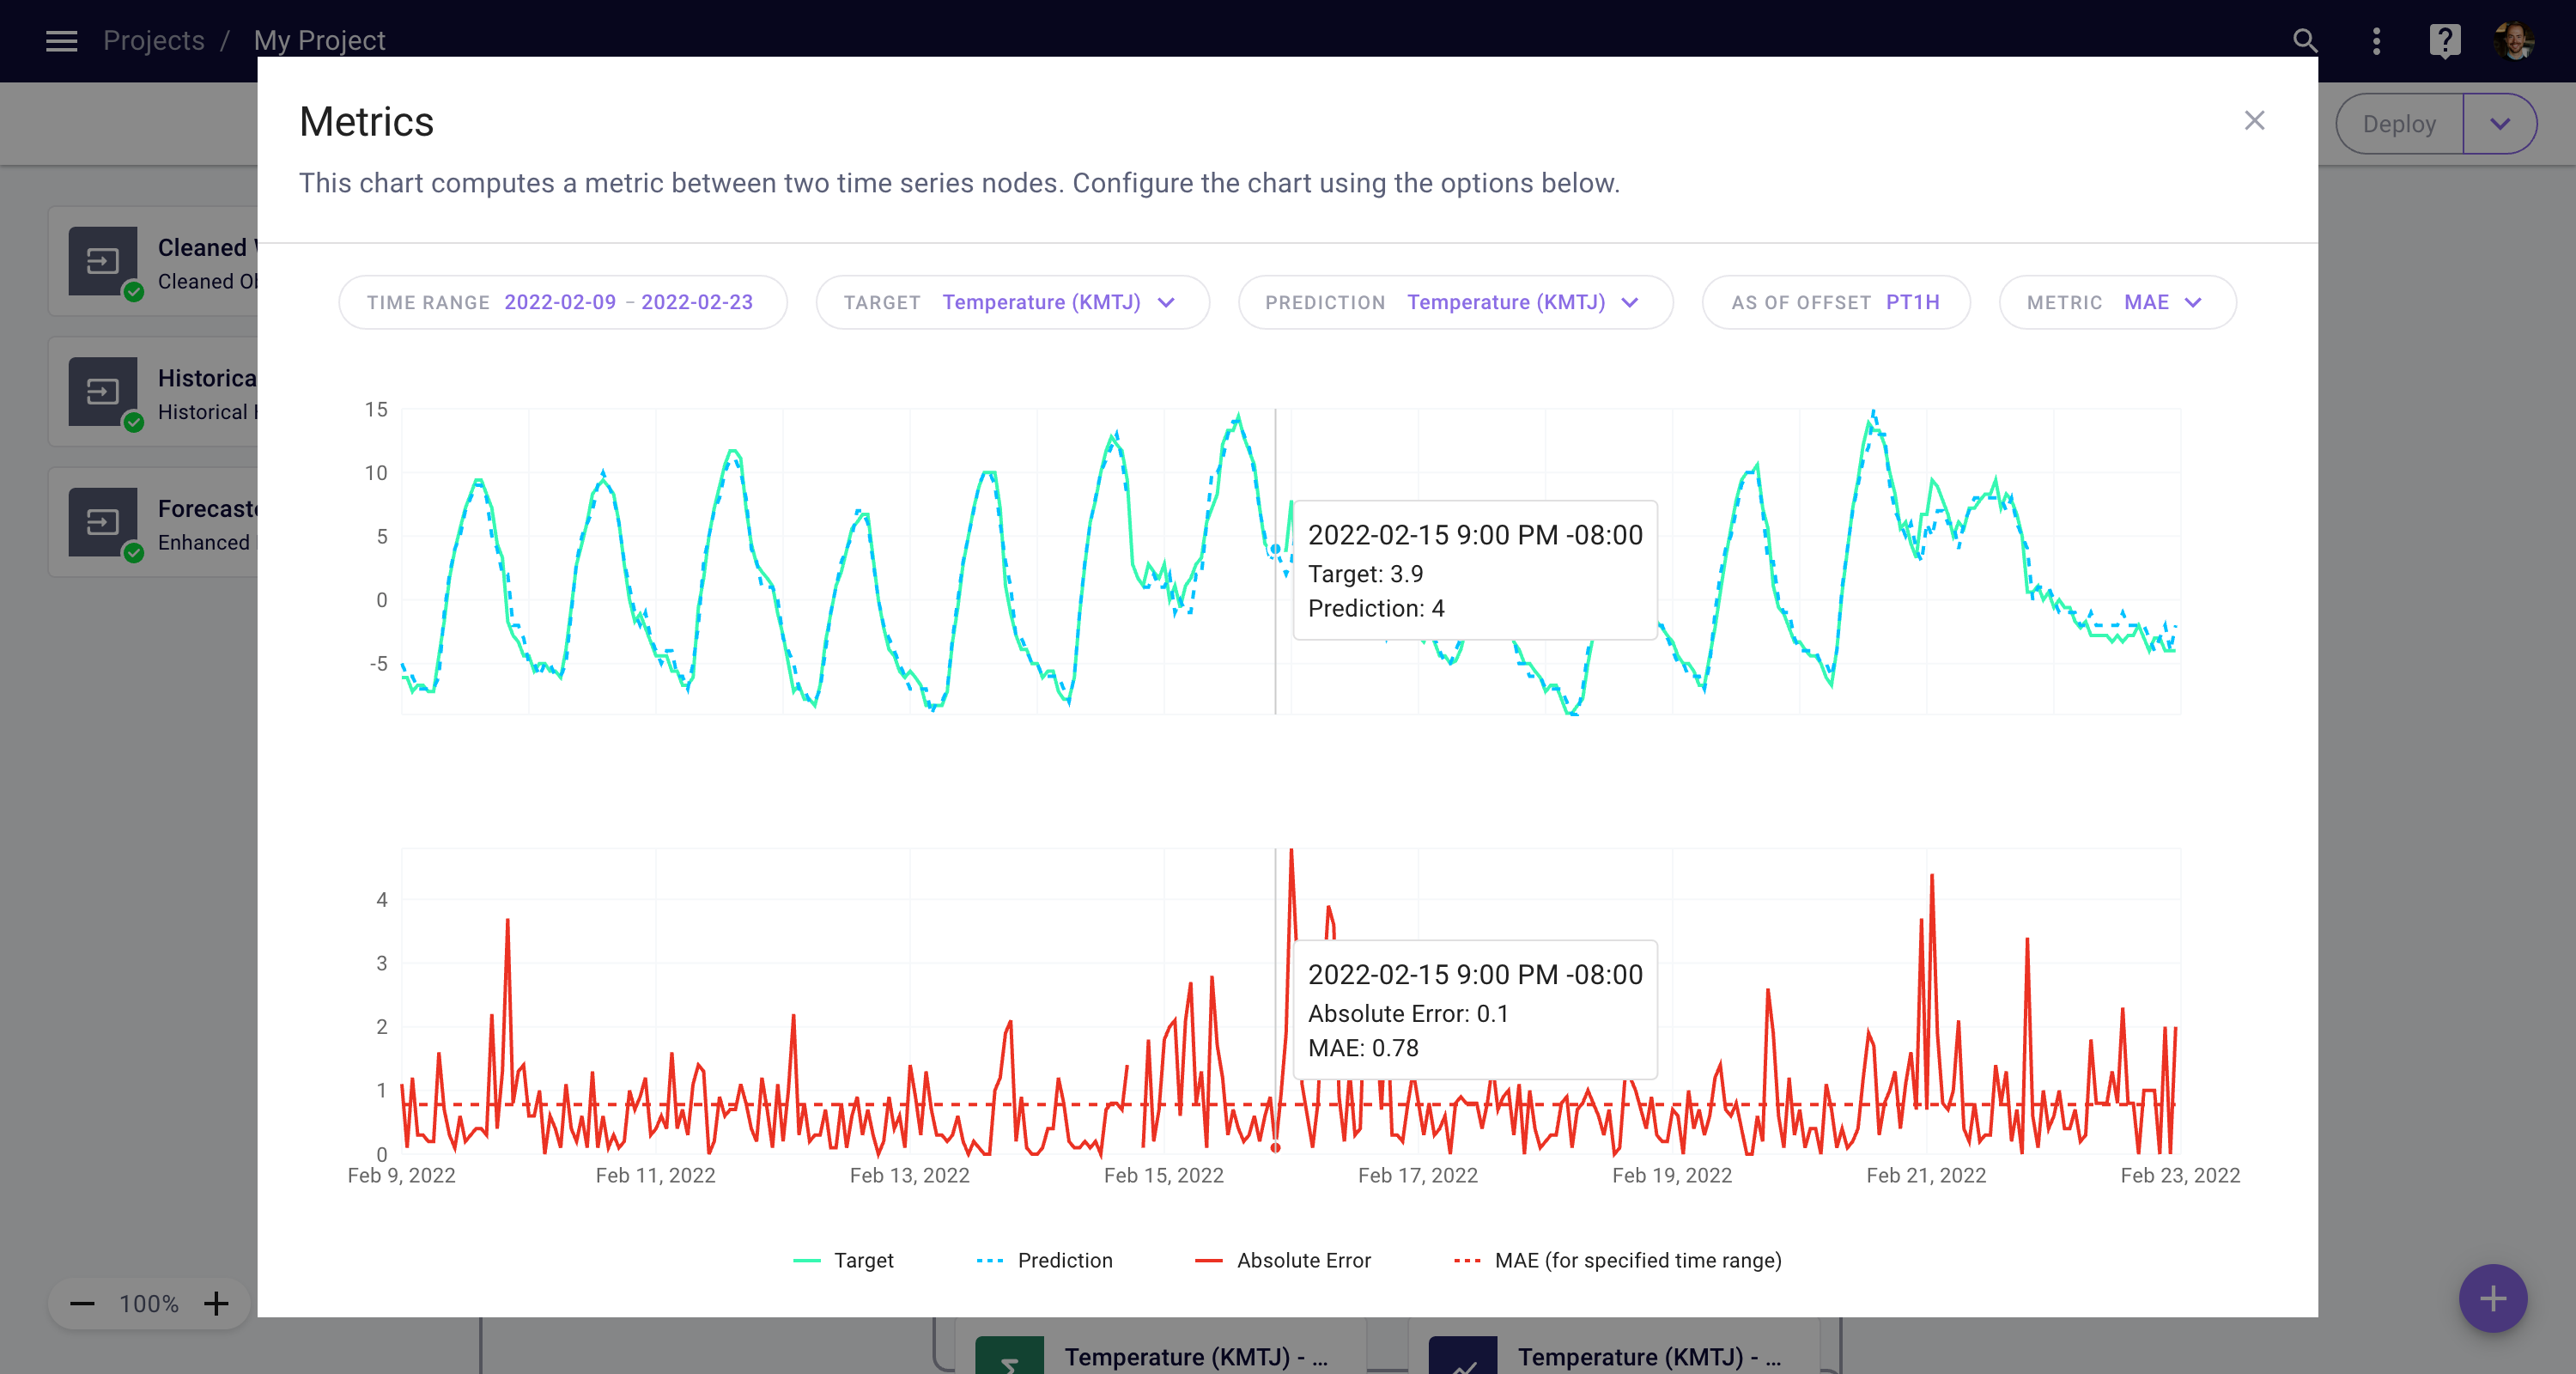
This will open the interactive metrics chart. Data will automatically loaded for the most recent 7 days. You can change the time range using the filters above the chart. You can also specify which Time Series should be used as the target and which Time Series should be used as the prediction.

View metrics for a Time Series
The specified metric (e.g. MAPE, MAE, MSE) will be computed by comparing the target Time Series to the prediction Time Series. Note that the As Of Offset is applied to the prediction Time Series. For example, an As Of Offset of PT24H will show the accuracy of all 24-hour ahead predictions over time.
Zooming and Panning
You can zoom-in on the graph by clicking and dragging, and double-click to zoom-out completely. To pan the graph, you can hold Shift while clicking and dragging, and double-click to reset the pan.
Updated about 4 years ago