Create and Run a Backtest
This topic explains how to create and run a Backtest using the Myst Platform
Creating a Backtest
In addition to supporting the deployment of Networks of Time Series (NoTS) to create and store ongoing Model predictions, the Myst Platform also supports model backtesting. Backtesting allows users to generate Model predictions for a historical period of time. Users can analyze the results of a Backtest flexibly in our client library to help them decide whether a Model is meeting their needs. Today, most backtests complete in five to 10 minutes.
To begin creating a Backtest, first log in to the Myst Platform and create a new Project or select an existing Project. Then make you sure you have created a NoTS with a Model you want to backtest.
Guardrails
Backtests must be parameterized to complete within three (3) hours. Backtests running longer than this will be terminated. To help achieve this goal and to keep the load on our platform stable, we have introduced the following guardrails:
- A maximum of 52 folds and 10,000 predictions per fold is allowed
- A maximum of ten concurrent backtests can be running in the same project
Exceeding these limits will raise an error in the client library and in the web application. If you would like to run more than ten backtests, you can queue backtests in a loop, while ensuring that no more than ten are running concurrently. Deleted backtests do not count agains these limits.
Note: There are many other factors that impact backtest runtime: model parameters, feature count, backtest configurations, and characteristics of your dataset all play a role. Here are some tips for keeping runtime within a three-hour window:
- Reduce number of fit folds
- Use a smaller test period
- Use only as much training history as helps accuracy (We've seen gains by trimming data older than 2-3 years for certain price forecasting applications.)
- Use a coarser sample period (The fifteen minute market may not need to be forecasted at 15 minute granularity - 1 hour granularity can perform comparably in many cases.)
- Use subsampling parameters for GBDTs (These can improve accuracy, as well!)
- Lower
num_boost_roundfor GBDTs in early development- Lower
max_epochsfor neural networks in early development- Start your neural networks with smaller embedding dimensions (This can sometimes also be a win for accuracy.)
Keeping these options in mind can be beneficial for your own iteration speed, as well!
Backtesting, deployment, and immutability
Note that when you run a Backtest in a Project that has not been deployed yet, the nodes in your NoTS will become immutable, which is achieved by creating an inactive Deployment in the background. Note that since the Deployment is inactive, this does not activate any of your Policies yet.
As a workflow, you can do things in the following order:
- Create a Project with a Model you would like to backtest
- Run one or more Backtests, which will make your NoTS immutable
- Deploy your Project, which will activate your Policies
Web Application
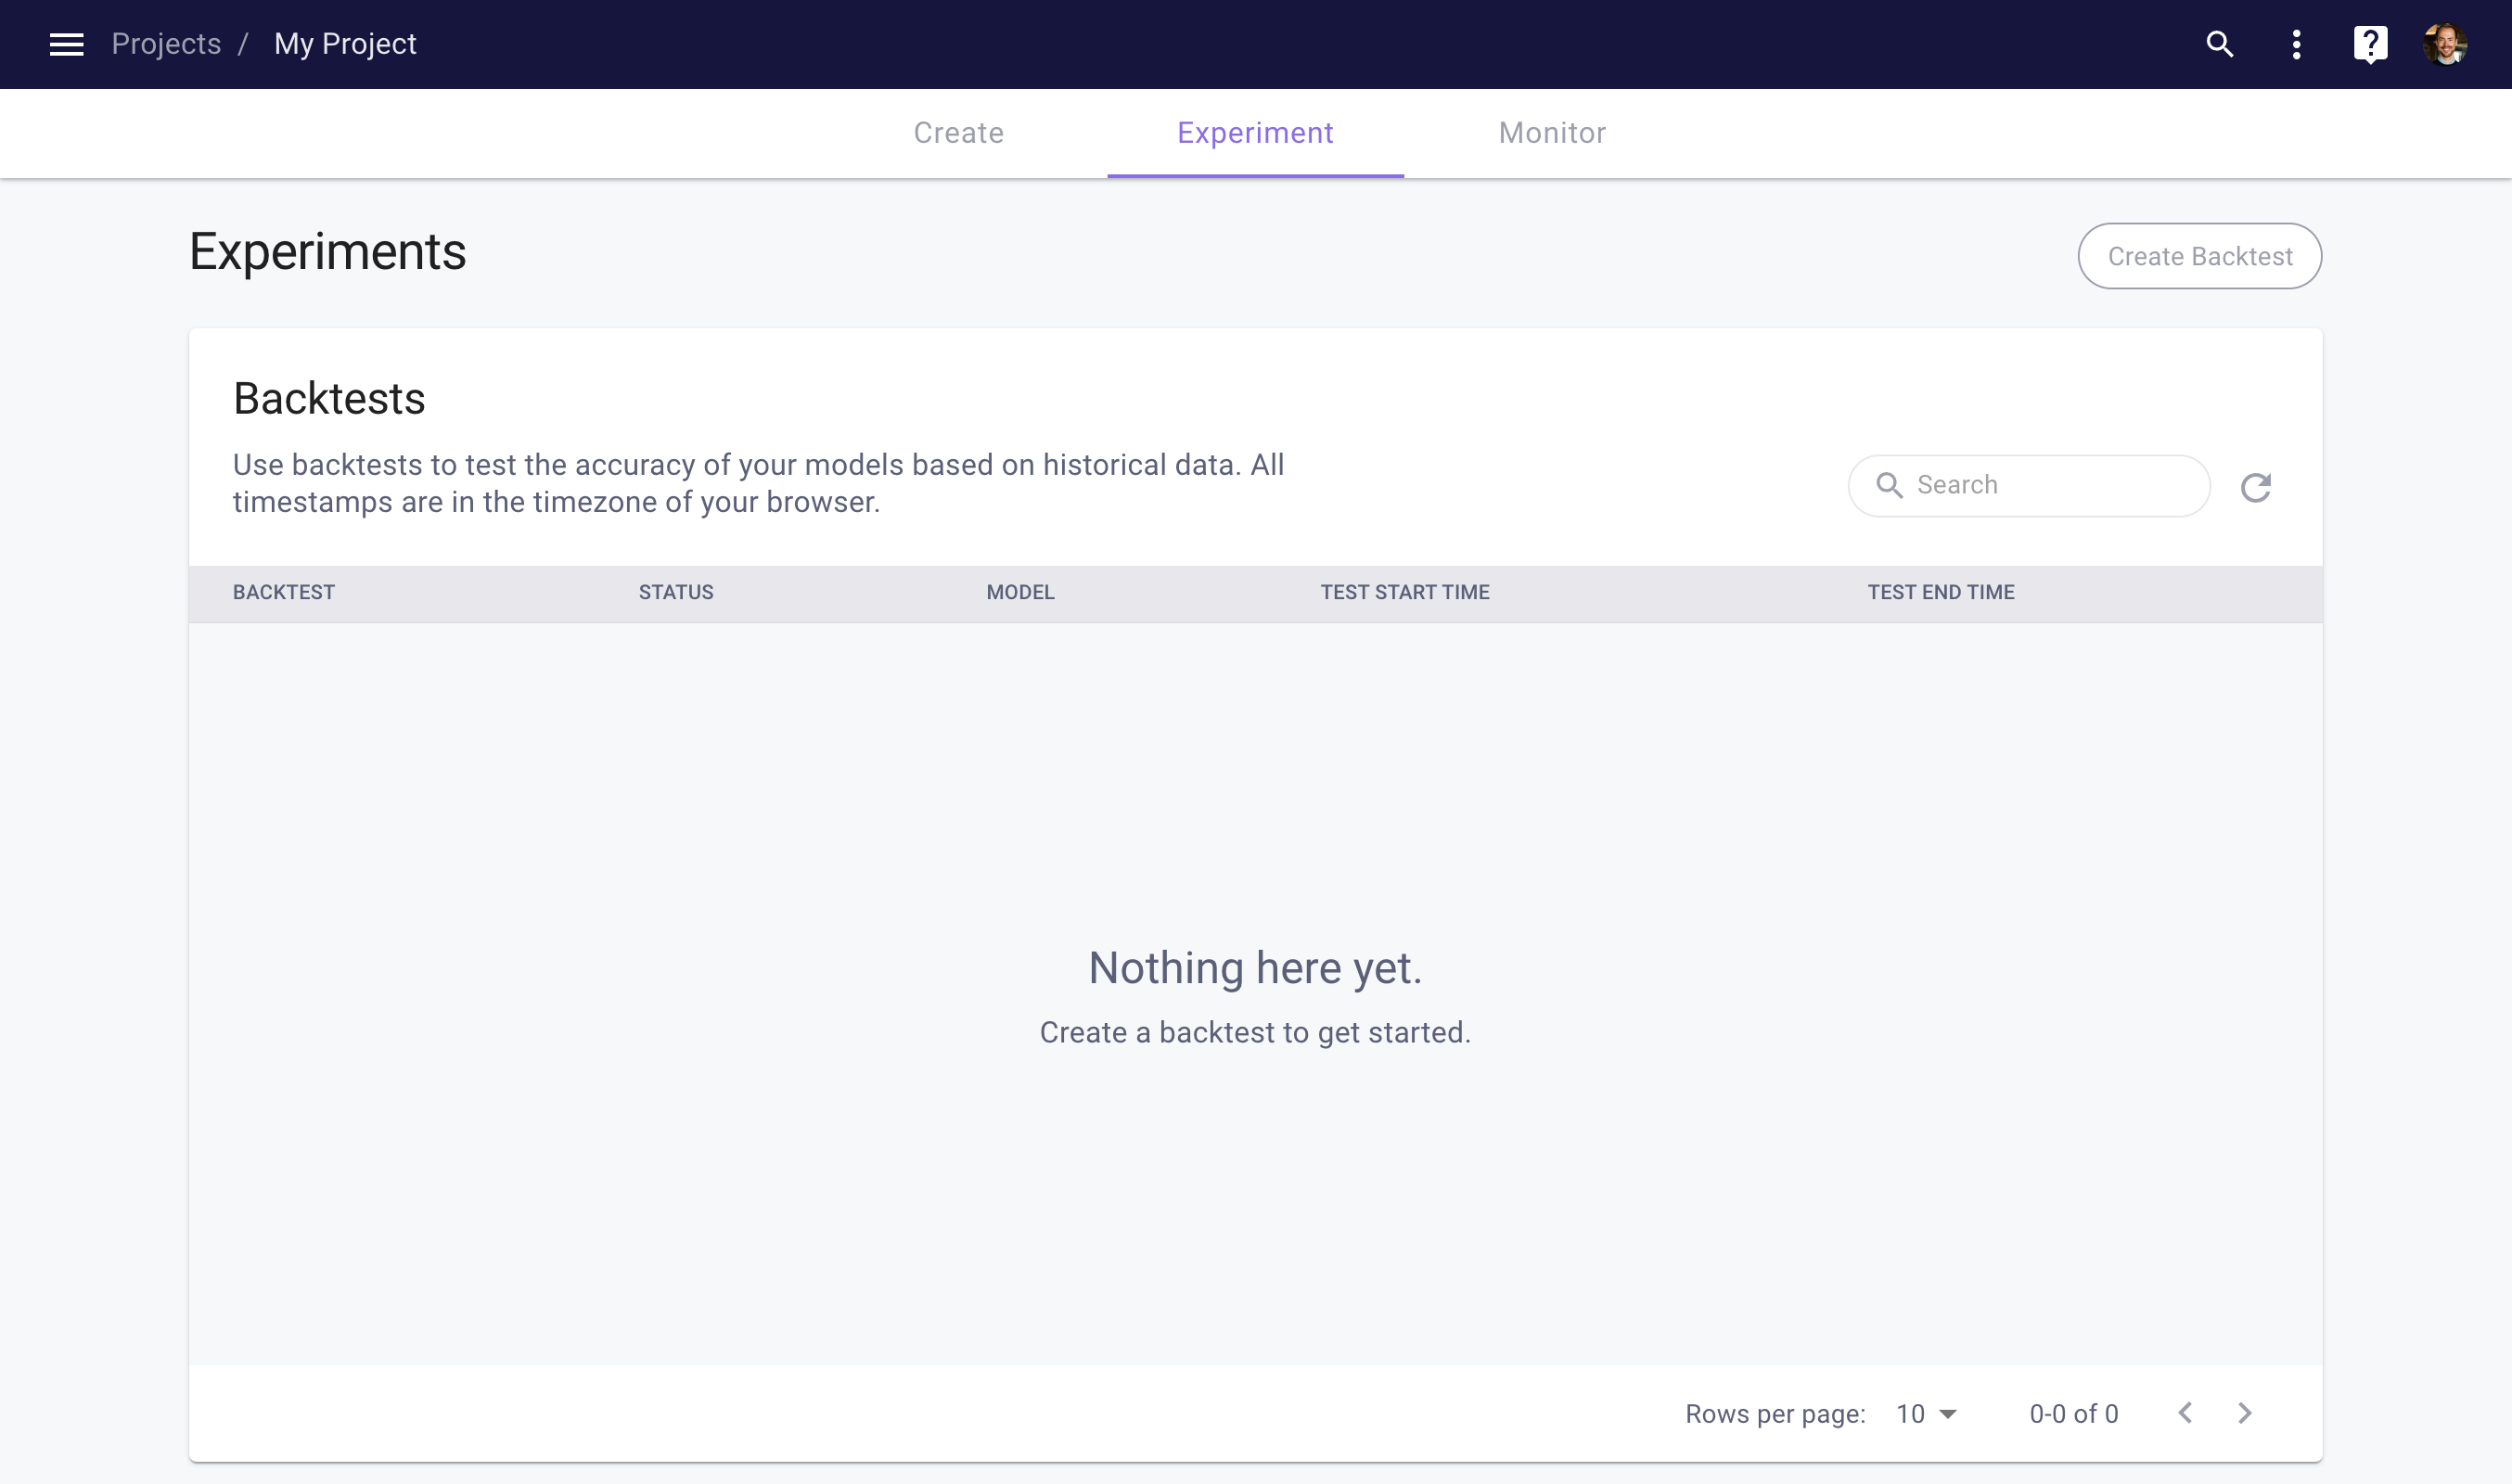
From the Project Experiment space, you can view the existing Backtests in your Project.

Project Experiment space
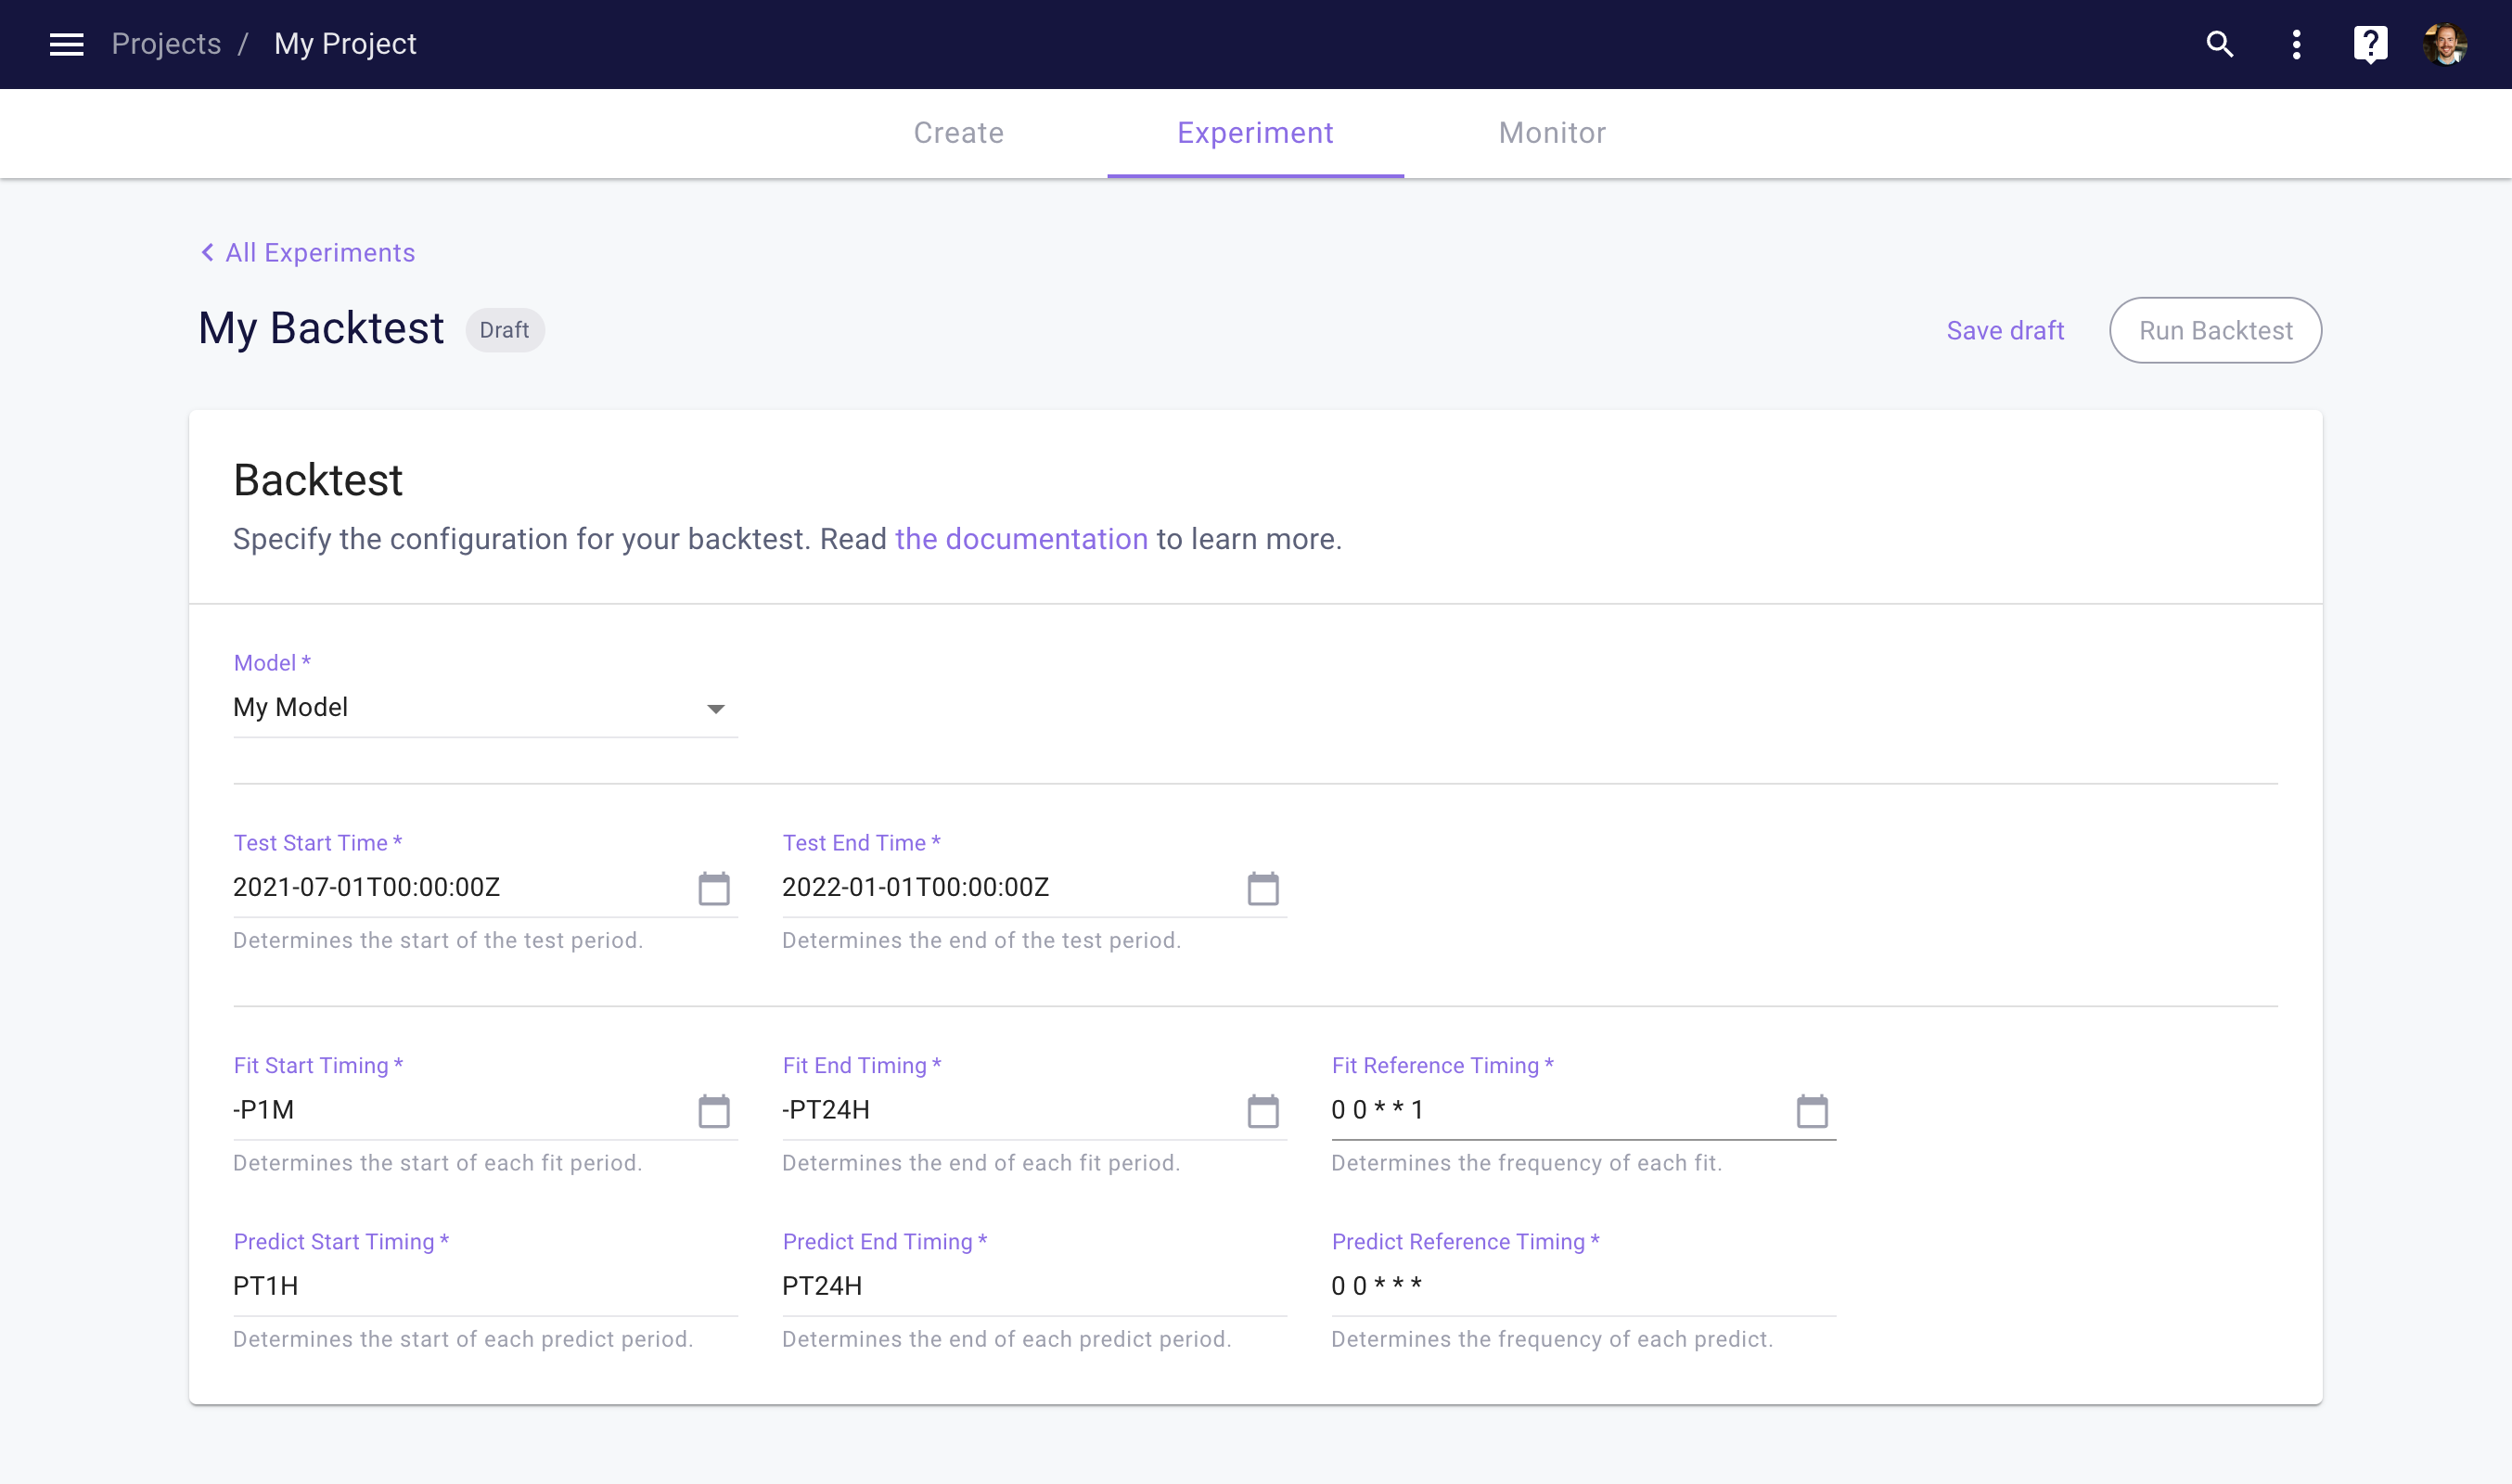
To create a new Backtest, click the Create Backtest button on the top right of the Backtests table. This will open the Backtest detail page, which allows you to configure your Backtest. See our Backtesting page for details on parameters and timing.

Backtest detail page
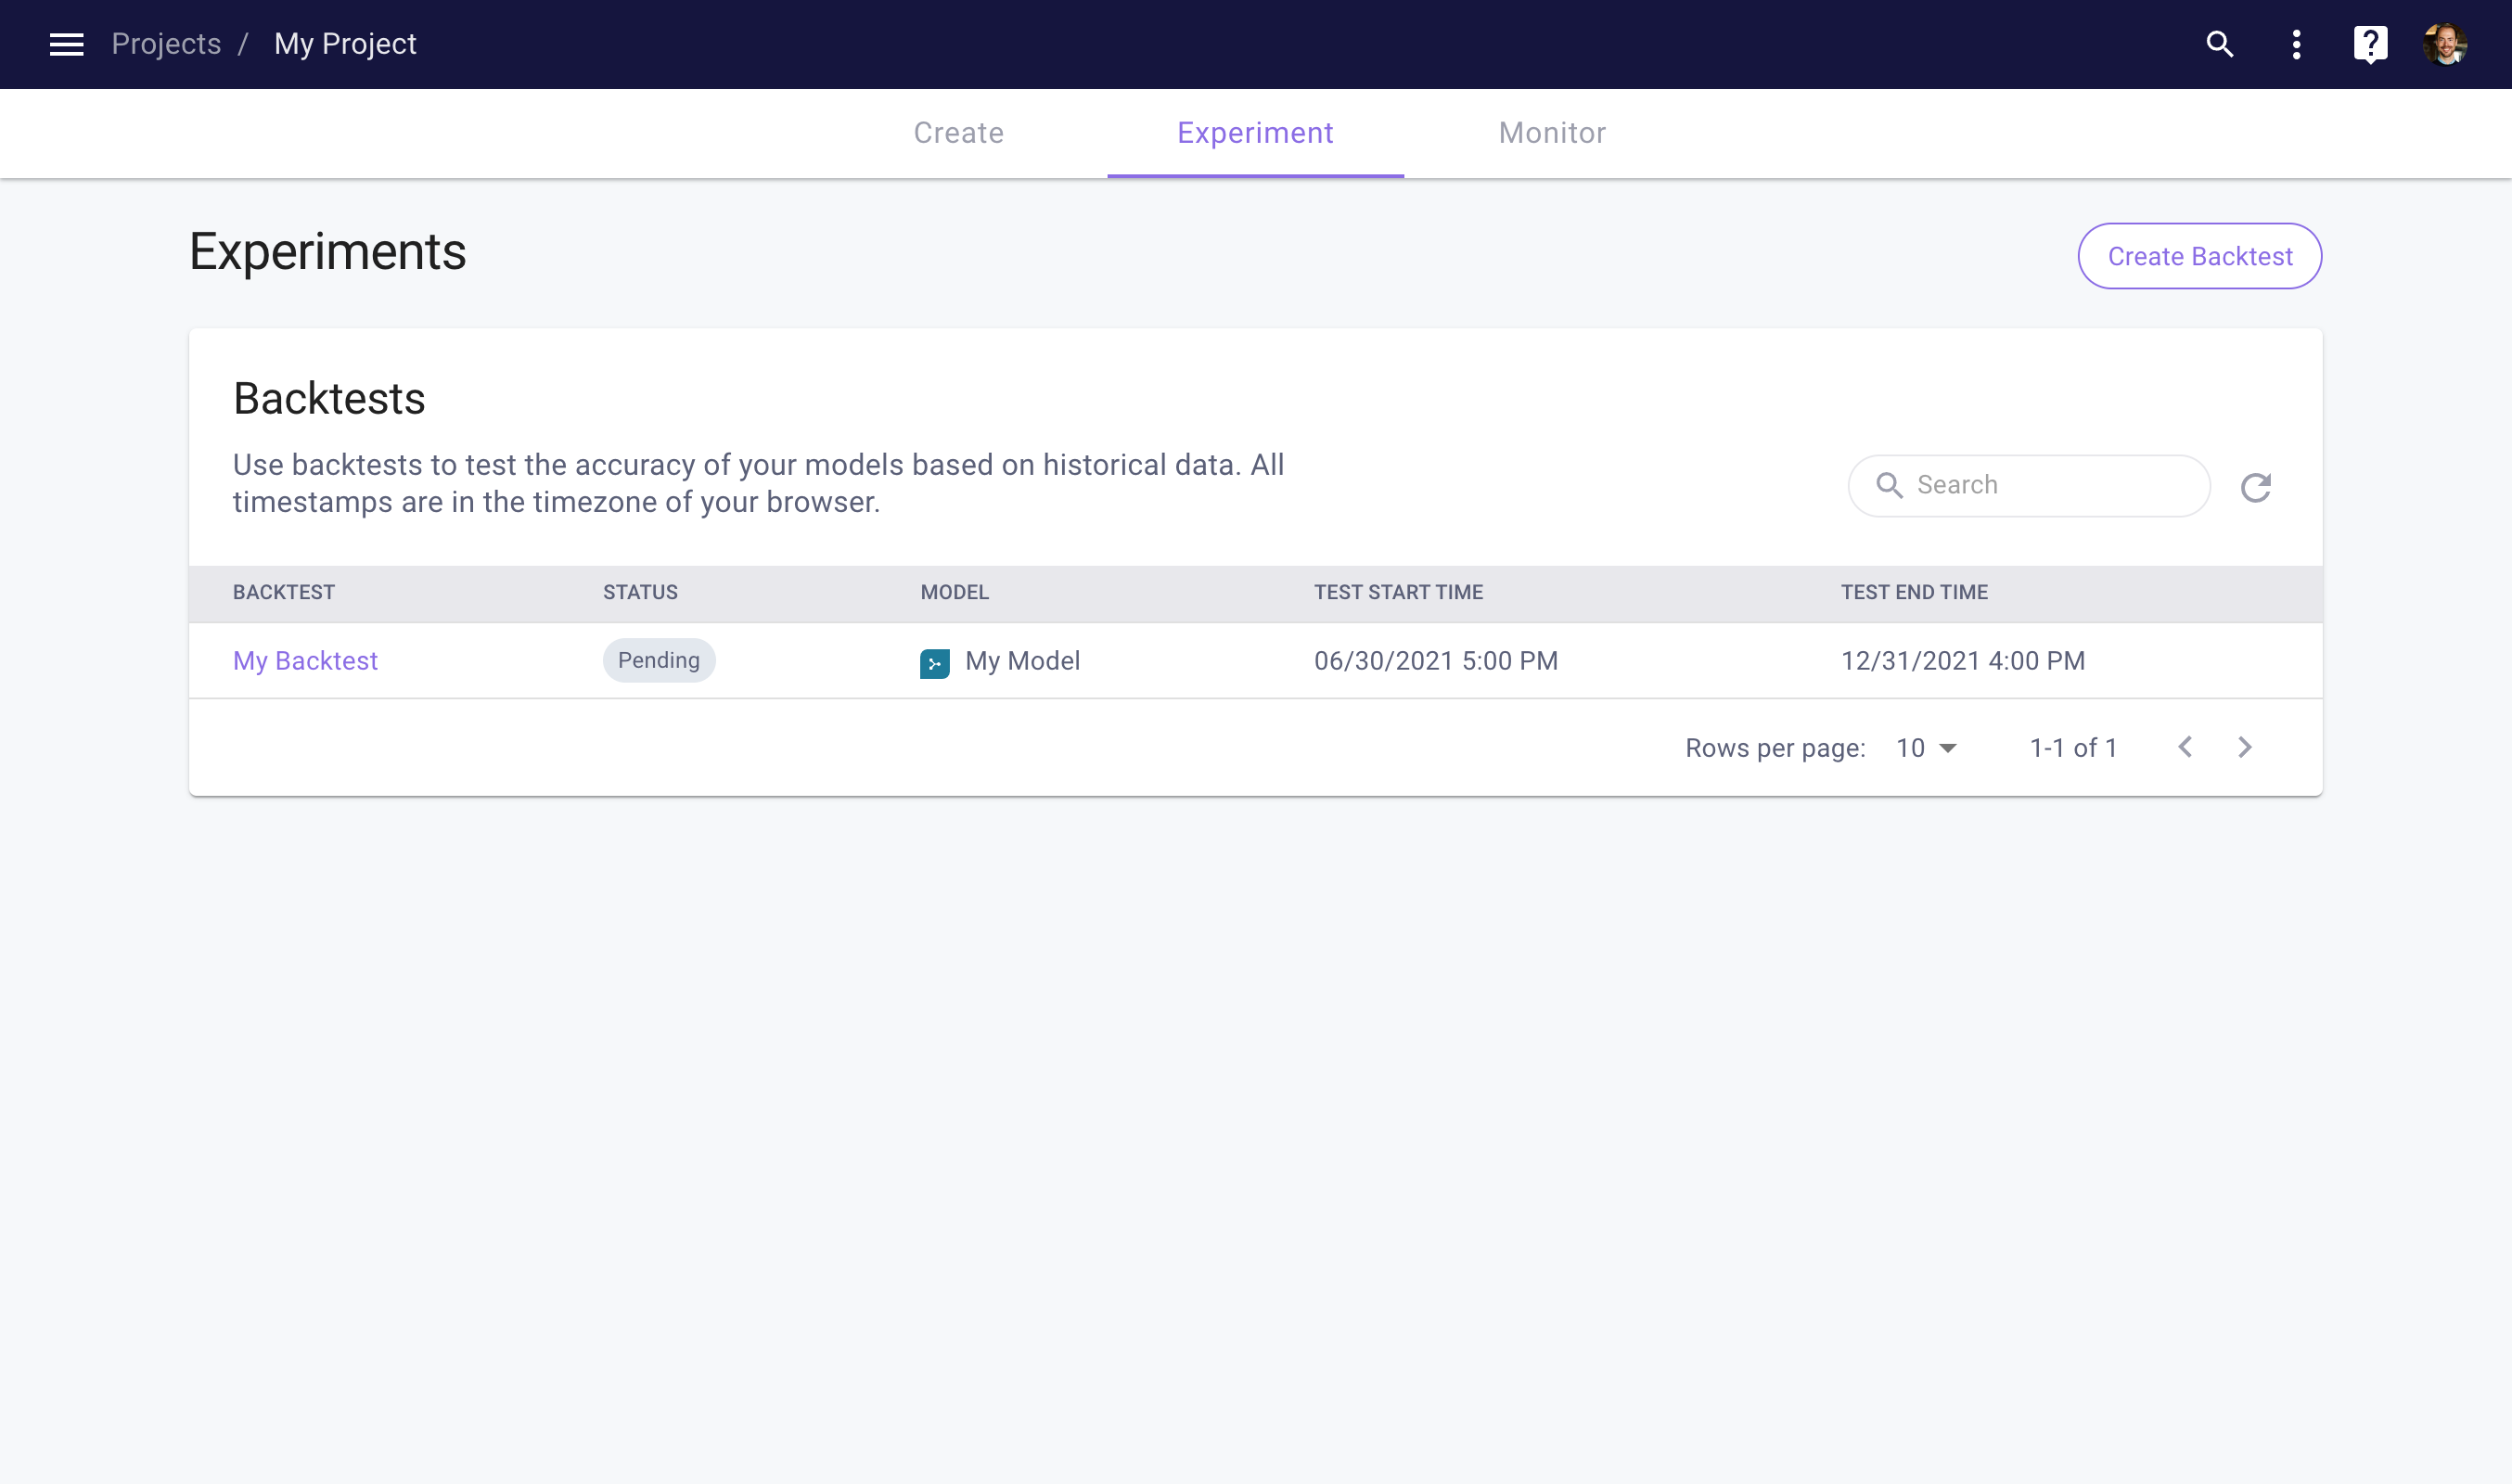
Next, click the Save Draft button to save the Backtest as a draft. Once saved, you will be able to run the Backtest by clicking the Run Backtest button. This will kick off the Backtest. You can track the progress of your Backtest by navigating back to the Backtests table.

Monitoring your Backtest progress
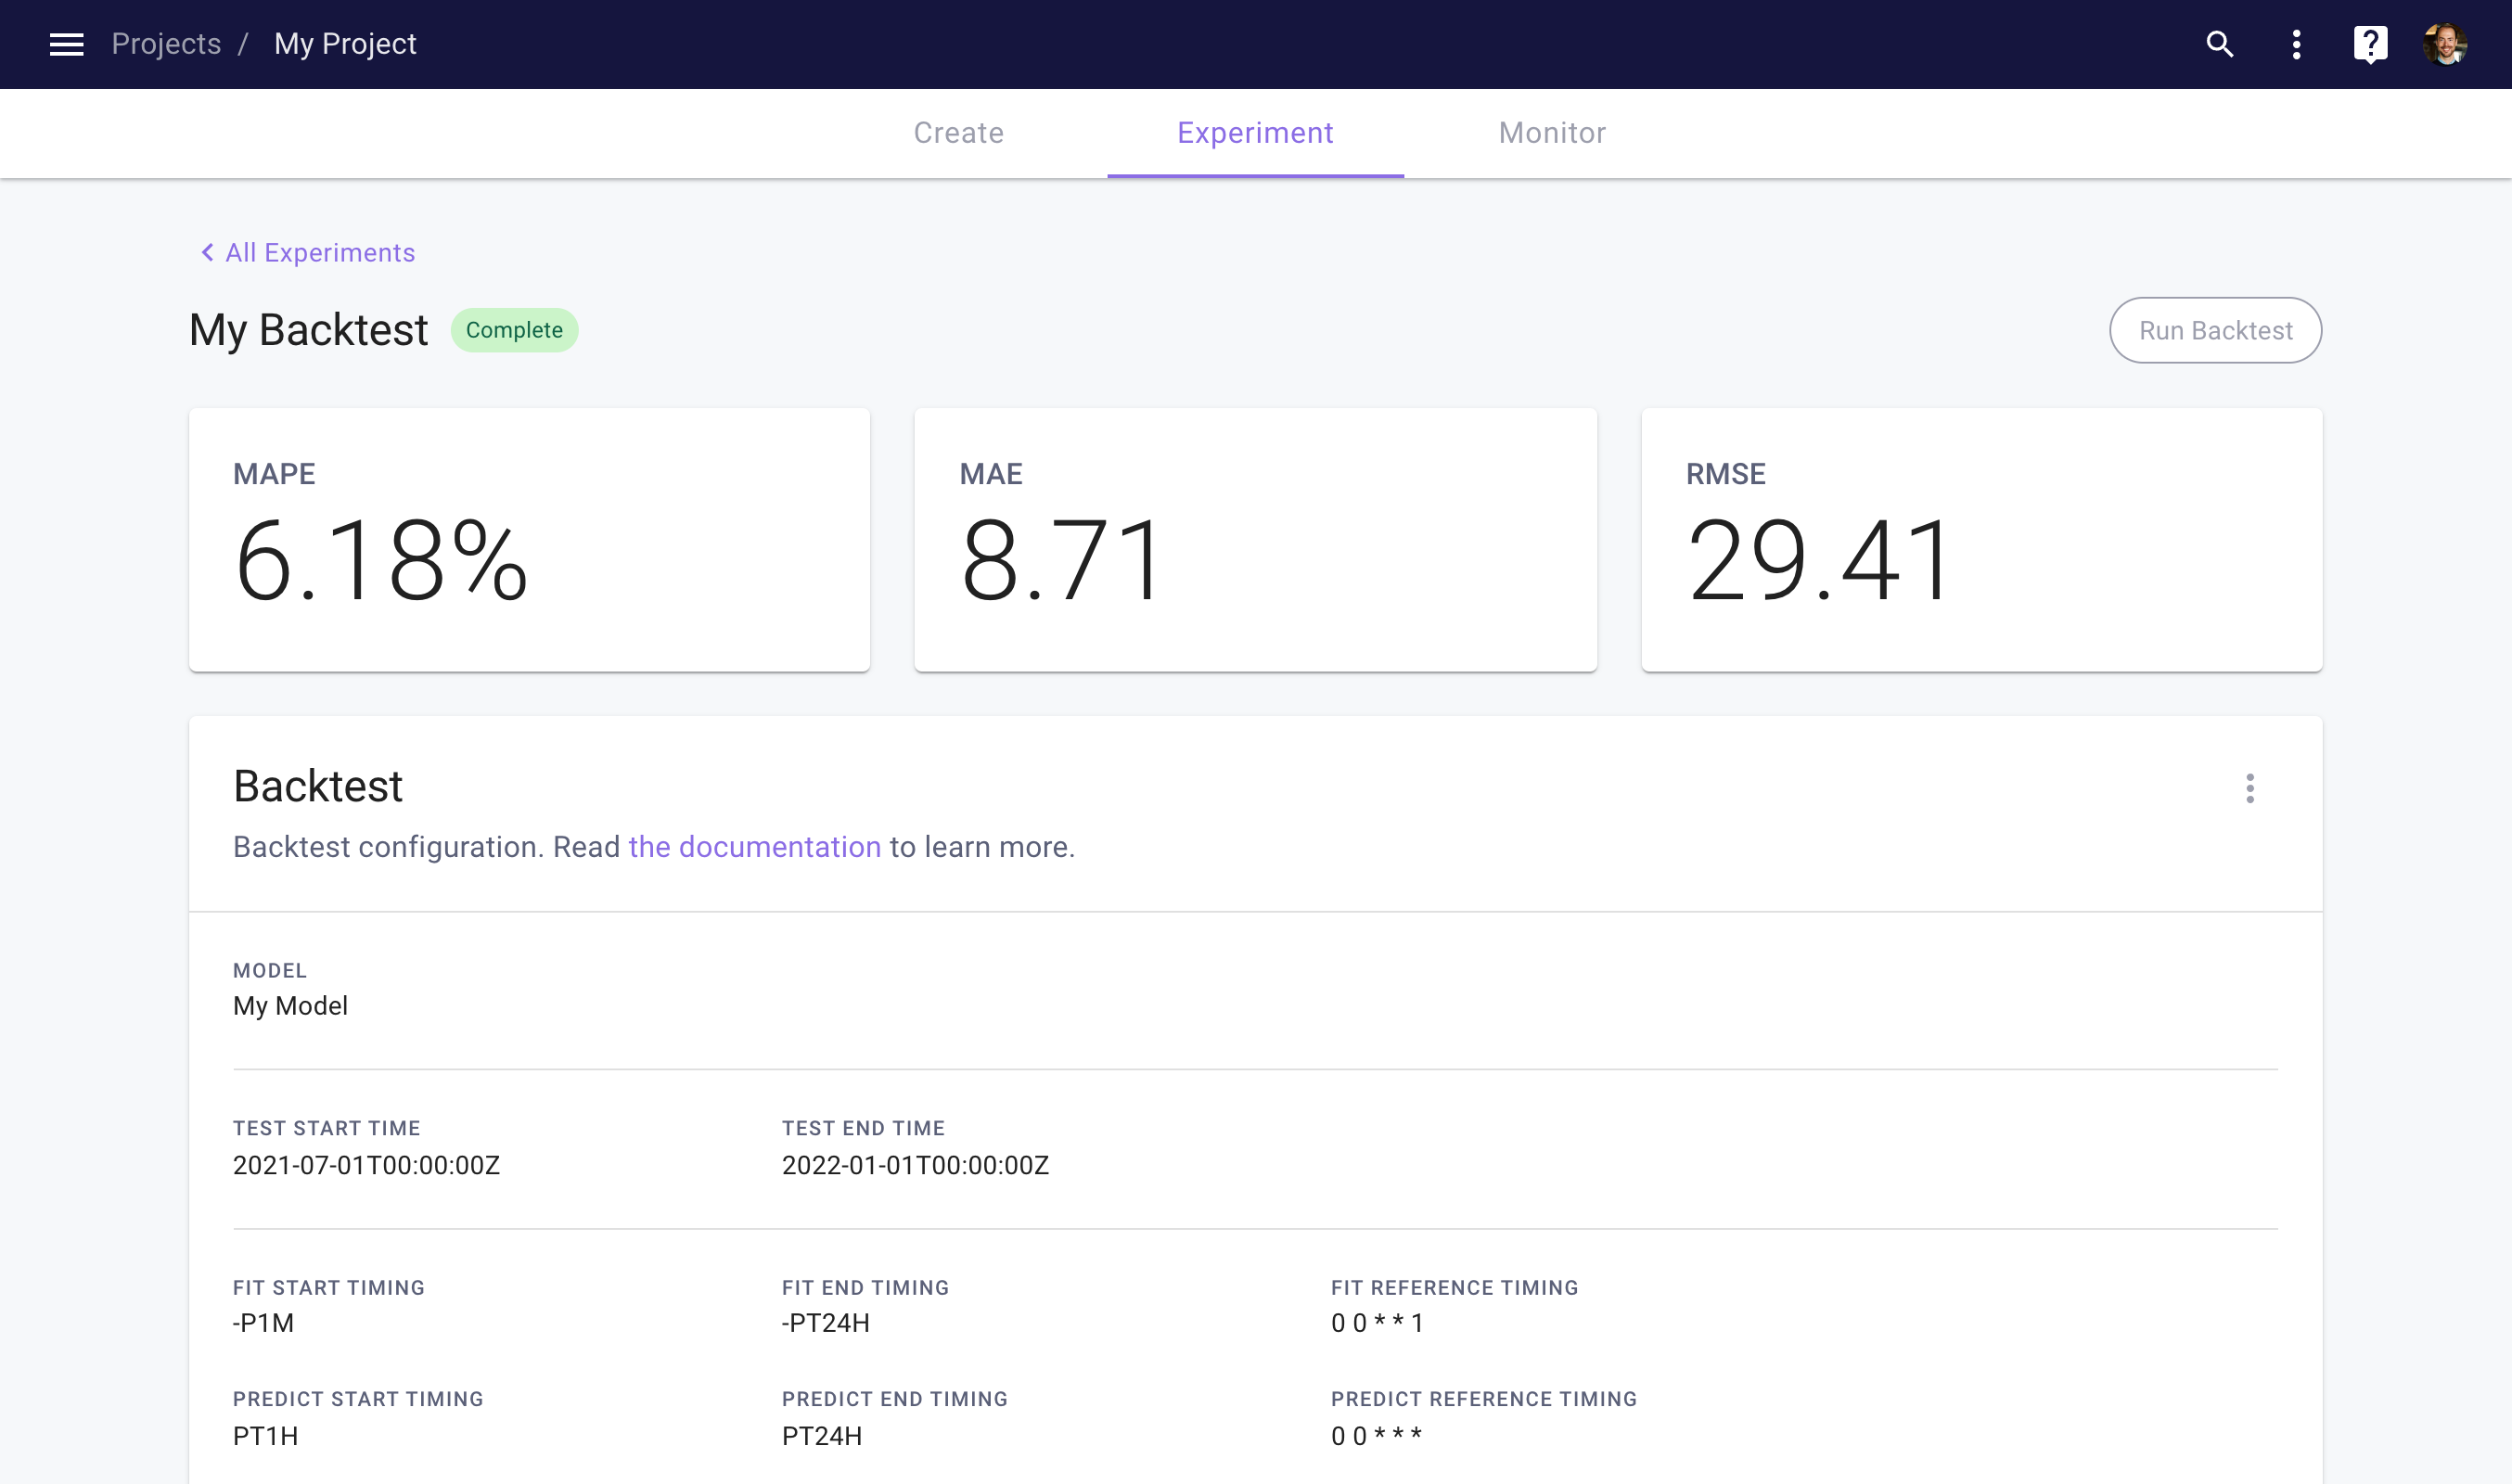
Once completed, you can view the results by clicking on the Backtest. This takes you to the Backtest detail page, which shows three accuracy metrics. To analyze the Backtest result in more detail, see this section.

View your backtest results
Client Library
To create and run a Backtest in the client library, you can use the following code.
import myst

myst.authenticate()

# Use an existing project.
project = myst.Project.get(uuid="<uuid>")

# Use an existing model within the project.
model = myst.Model.get(project=..., uuid="<uuid>")

# Create a backtest.
backtest = myst.Backtest.create(
    project=project,
  	title="My Backtest",
    model=model,
    test_start_time=myst.Time("2021-07-01T00:00:00Z"),
    test_end_time=myst.Time("2022-01-01T00:00:00Z"),
    fit_start_timing=myst.TimeDelta("-P1M"),
    fit_end_timing=myst.TimeDelta("-PT24H"),
    fit_reference_timing=myst.CronTiming(cron_expression="0 0 * * 1"),
    predict_start_timing=myst.TimeDelta("PT1H"),
    predict_end_timing=myst.TimeDelta("PT24H"),
    predict_reference_timing=myst.CronTiming(cron_expression="0 0 * * *"),
)

# Run the backtest.
backtest.run()
Analyze Backtest Results
Once a Backtest has completed, users can analyze the result of the Backtest using our client library.
Client Library
To extract the result of a Backtest in the client library, you can use the following code.
import myst

myst.authenticate()

# Use an existing project.
project = myst.Project.get(uuid="<uuid>")

# Use an existing backtest within the project.
backtest = myst.Backtest.get(project=..., uuid="<uuid>")

# Wait until the backtest is complete.
backtest.wait_until_completed()

# Get the result of the completed backtest.
backtest_result = backtest.get_result()
Once you have extracted your Backtest result, you can use the following code to generate metrics.
# Map the backtest result to a pandas data frame.
result_data_frame = backtest_result.to_pandas_data_frame()

# Compute some metrics for the backtest result.
absolute_error_series = (result_data_frame["targets"] - result_data_frame["predictions"]).abs()
absolute_percentage_error_series = absolute_error_series / result_data_frame["targets"].abs()

# Print the MAE and MAPE across all predictions.
print(absolute_error_series.mean())
print(absolute_percentage_error_series.mean())

# Create an index with the prediction horizons.
horizon_index = (
    result_data_frame.index.get_level_values("time") -
  	result_data_frame.index.get_level_values("reference_time")
)

# Print the MAE and MAPE for each prediction horizon.
print(absolute_error_series.groupby(horizon_index).mean())
print(absolute_percentage_error_series.groupby(horizon_index).mean())
Updated over 3 years ago