Random Forest, Linear Regression, one-hot encoding and more
Myst Platform Release (2022-03-14)
Hello Myst Platform users,
This week’s release is chock-full. We have two new (and renewed) model connectors for you, a power operator, updates to weather data, and a smoother project sharing experience in addition to a number of web UI improvements. Many of these updates are in response to your feedback – so thank you for sharing helpful insights!
Please update your myst-alpha package at your earliest convenience to access these updates (instructions here).
✨ New features:
- The Random Forest connector is ready for use! We have found Gradient-boosted decision trees more powerful than Random Forest in our own forecasting work but consider Random Forest a good baseline model. You can read more about Random Forest here.
- The Linear Regression connector is ready, too. Linear regression is useful as a benchmark forecast in certain cases, such as when persistence forecasts have good accuracy.
- One-hot encoding is now possible – enabling categorical variables in your graphs. Today, you must manually specify your categories as a connector parameter. This does not allow for situations where the number of categories is unknown; we are working towards accommodating those scenarios. We recommend using this connector to create dummy variables for common, low-cardinality categoricals such as day of week and month of year. Please find our updated tutorial on this here.
- You can now use the power (**) operator in the Numerical Expressions and Conditional Expression Mask connectors.
- Cloud coverage percentage (“cloudCoveragePercent”) from Atmospheric G2 (formerly The Weather Company) is now available for the most recent 24 hours – accessible through the Historical Hourly Conditions (HHC) source connector. Atmospheric G2 offers cloud coverage data for the most recent 24 hours via an “Okta scale” interpretation of their icon codes rather than through the HHC API itself. We have combined these for a simpler user experience!
- Tired of toggling between the web UI and your client library code to share your projects? We’ve got you. You can now share (with view and edit access) your projects directly from the client library.
⚡️ Enhancements:
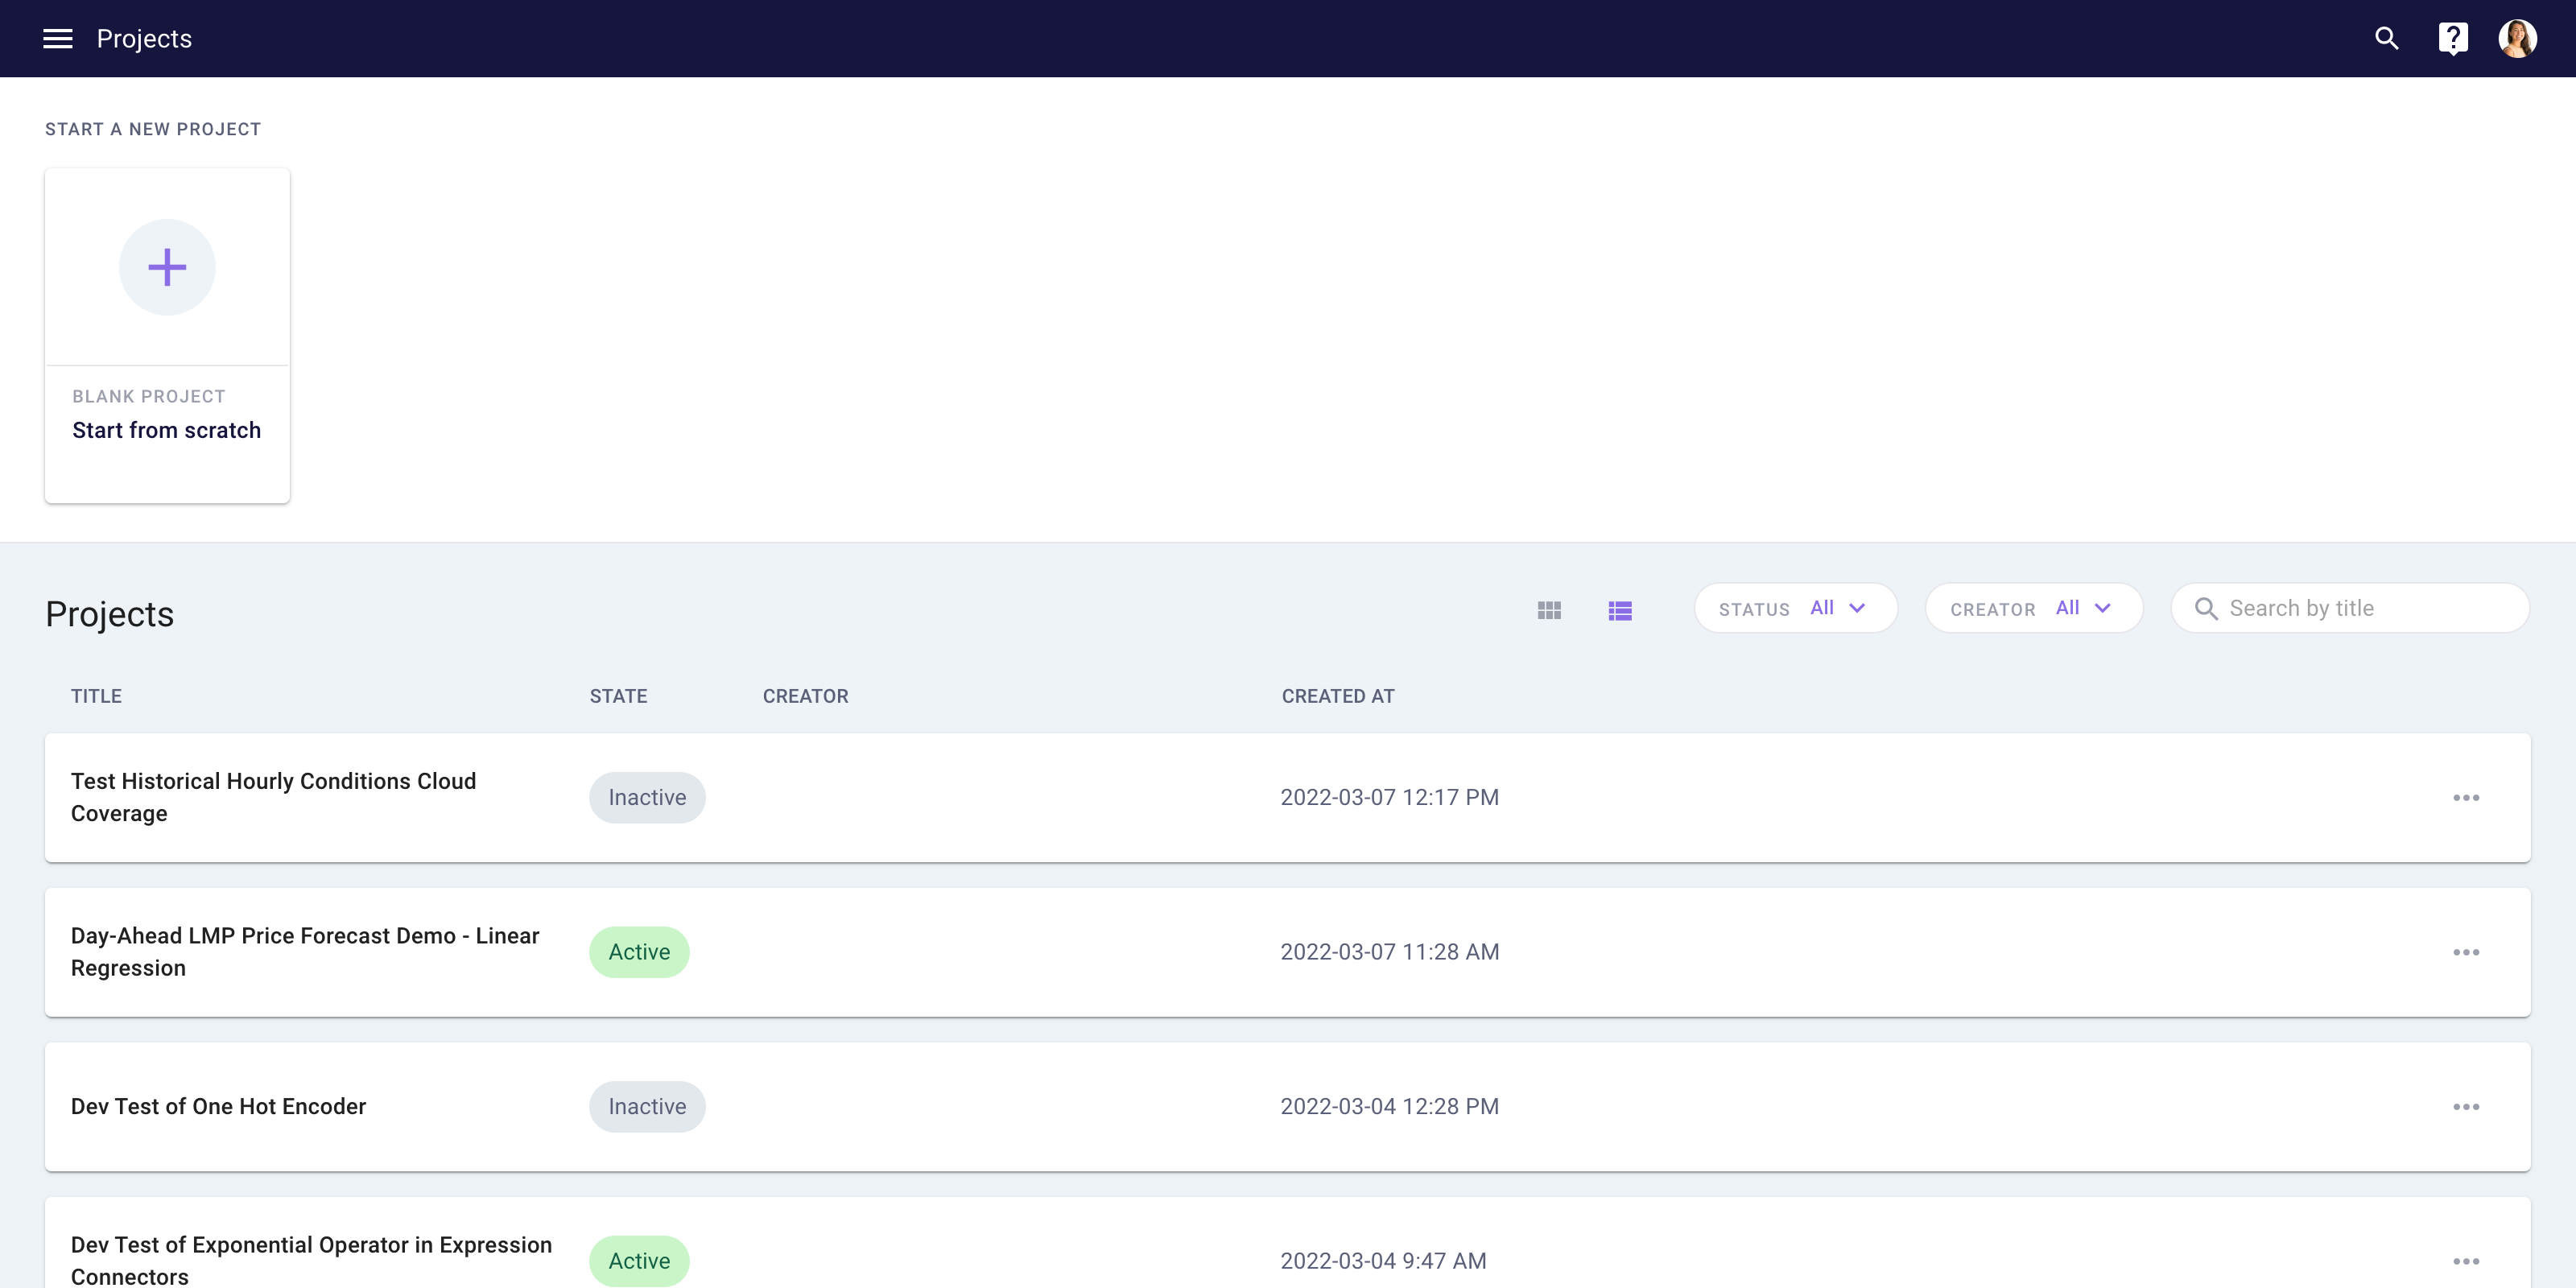
- The web UI is sporting a new look! You can now view your projects in a list (instead of as cards) so that it’s easier to see and scroll through a longer list of projects.

- Looking for your active projects, for projects you authored, or perhaps for a specific project (by name)? You can now filter for “Active” (deployed), “Inactive” (previously deployed, now deactivated), and “New” (never deployed) projects. You can also filter for projects by creator and search for projects by title. We hope this helps you monitor your active projects more easily.
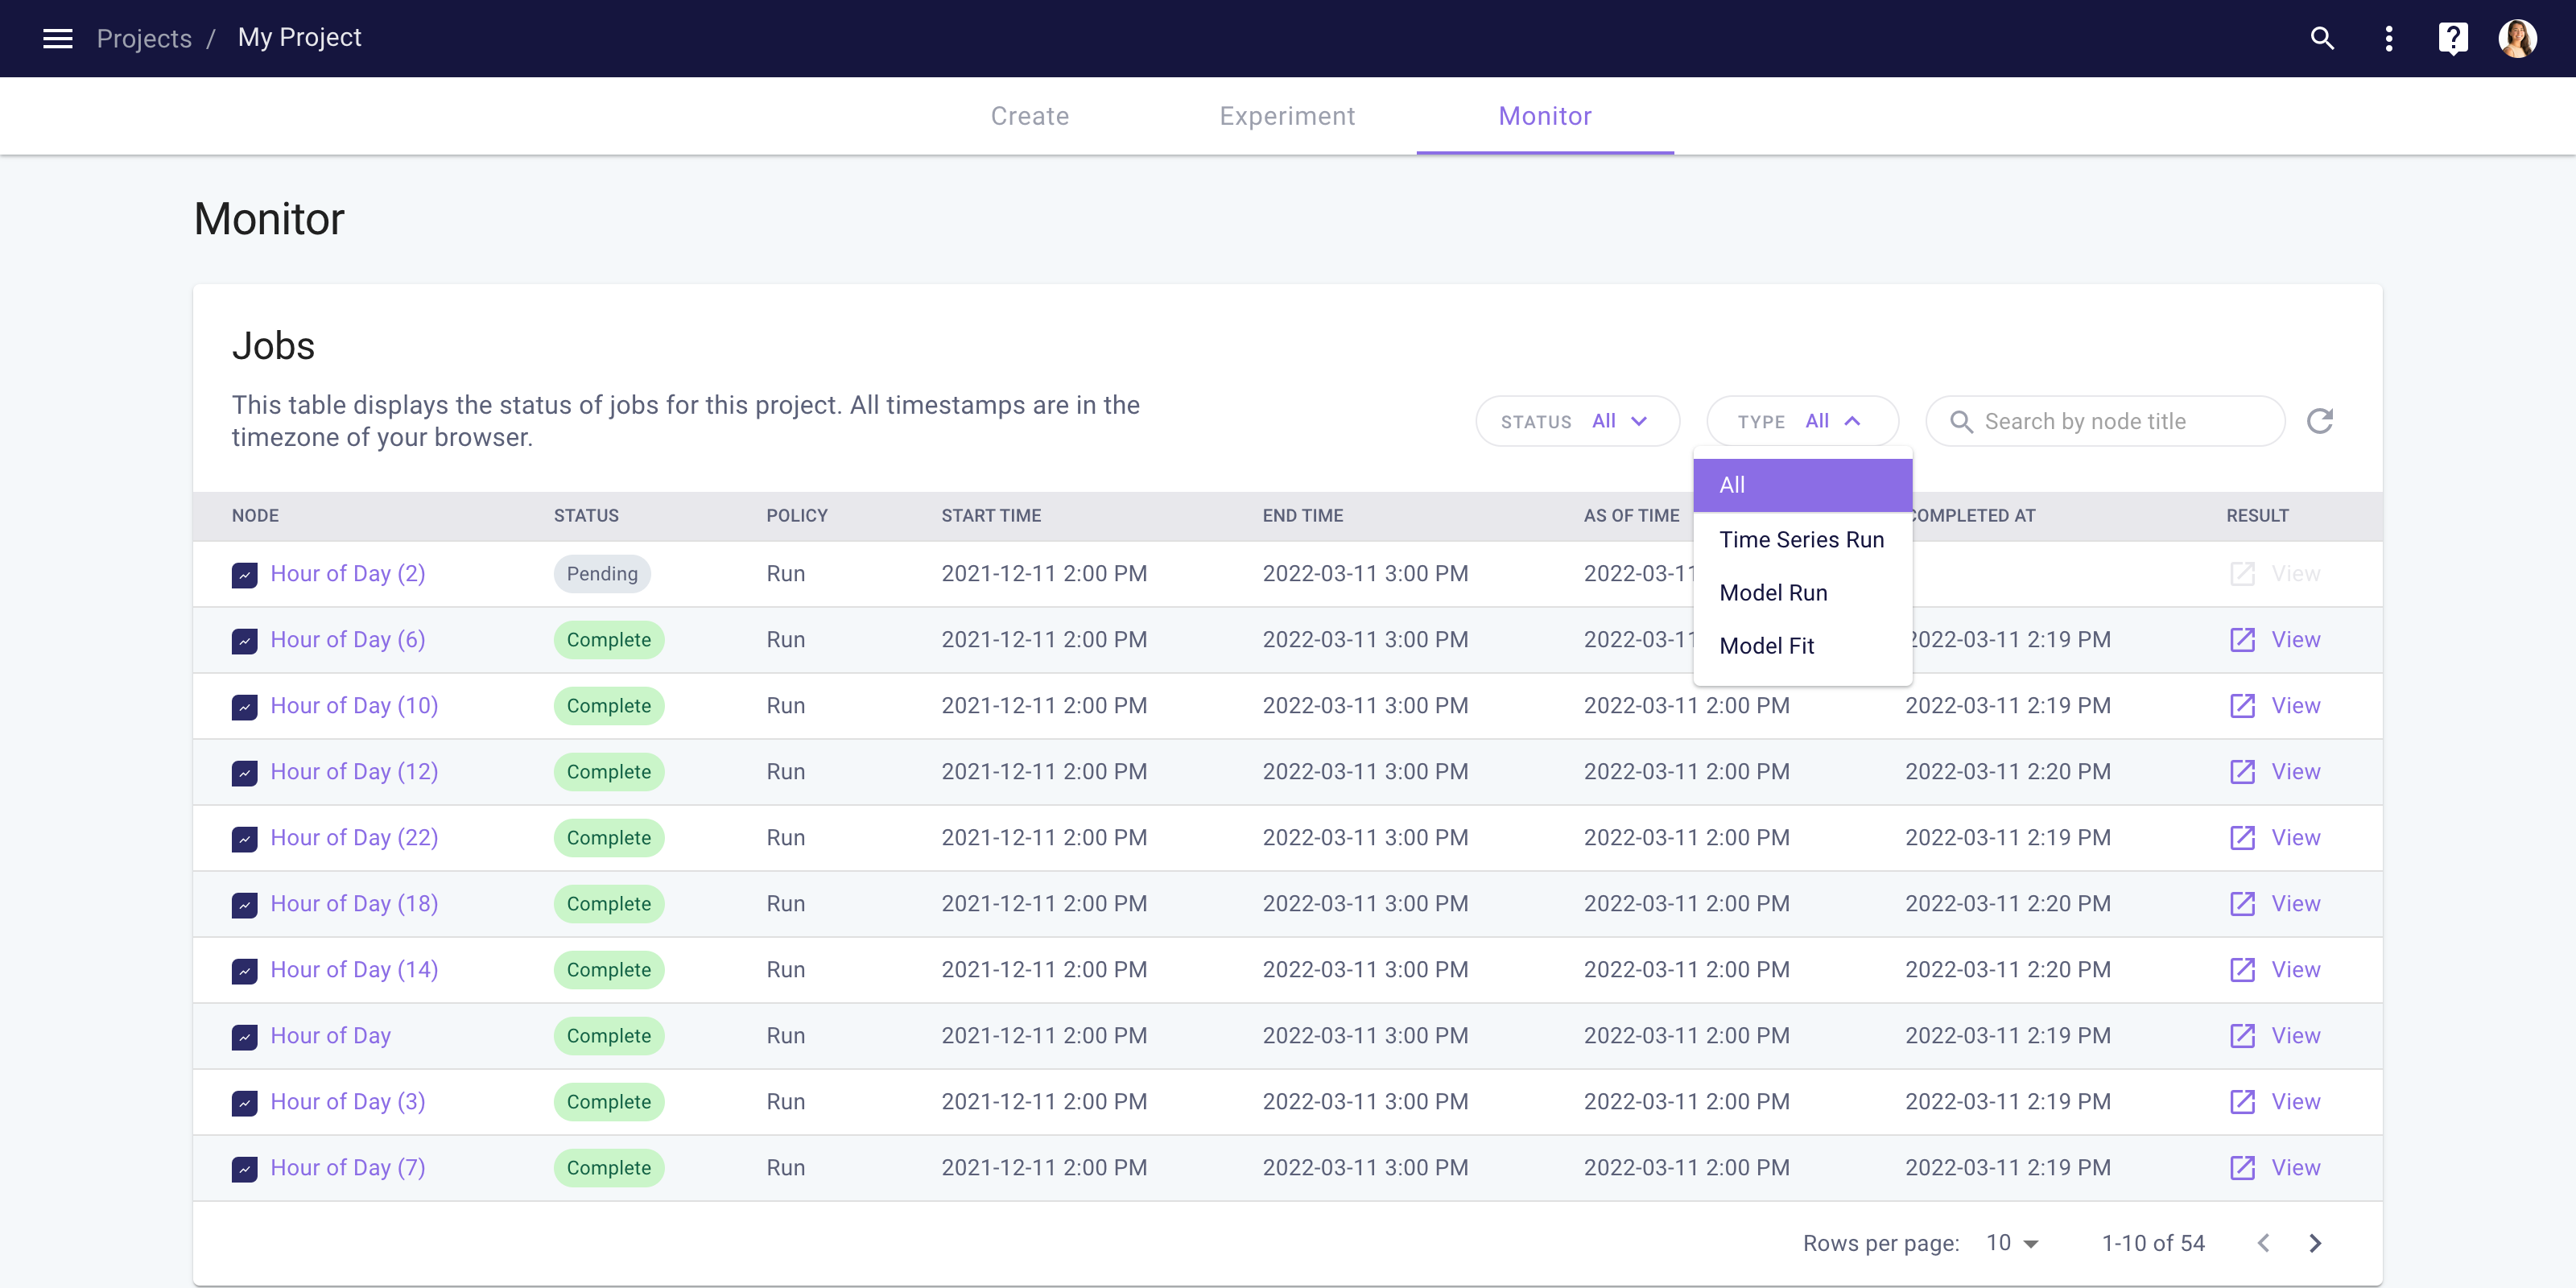
- In the web UI Monitoring page, you can filter your jobs by status (“Complete”, “Pending”, “Running”, and “Failed”), by type (“Time Series Run”, “Model Fit”, “Model Run”), and by title. You can use these filters to check the status of our jobs, to confirm that a graph is generating predictions successfully, and to debug failed results.

- When you’re zoomed into a graph in the “Query node” or “View metrics” charts, you can now pan left and right by pressing Shift, clicking your mouse, and dragging left or right. We hope this makes it easier to traverse across adjacent hours and days (without having to zoom out and zoom back in) to better understand patterns in your results.
✅ Bug fixes:
- We fixed a bug that caused backtests to fail if one of the inputs included null data – for example, if weather data did not cover a sufficient time range for a backtest.
- We fixed a bug that caused backtests to fail if a backtest’s predict timing was was not aligned with its test start time. Now, you can specify a backtest that generates predictions after your specified start time – meaning you do not have to carefully align predict start and predict reference timings with your test start time.
- You can now call
backtest.run()from the client library or click “Run Backtest” in the web UI without first deploying your graph and without specifying policies for your graph. This had a bug in the previous release that is fixed now.
Tip: Search quickly for projects using ⌘ + K or CTRL + K
If you press ⌘ + K on a Mac or CTRL + K on a PC in the web UI, a search bar will appear. We recommend using this to search for projects by title, UUID, and deployment status (e.g., Active, Inactive, New). We’ve found this useful when we want to visually inspect a graph we’ve just created using the client library in the web UI – and want to look up a project by UUID.
As always, please do not hesitate to reach out via the chat embedded in the Myst Platform or email us at [email protected] with questions or feedback.
Thank you!
Ellery and the Myst team